First presented at OTWorld in Leipzig: The new release of the VisuPress software expands the PlantaPress foot pressure measurement system with powerful comparison features for an even clearer evaluation of pressure measurements.
With PlantaPress, users can reliably and practically record static and dynamic pressure distributions — for example in orthopaedic technology, diabetology, sports medicine, or in the provision of custom insoles and orthopaedic shoes. The associated VisuPress software supports the entire process, from measurement data acquisition and analysis through to documentation.
With the new software release, evaluation becomes even more convenient: reference markers, a dynamic comparison table, and extended PDF report functions help users mark relevant pressure points, compare them with one another, and document the results in a clear and traceable way.
New Reference Markers: Mark Pressure Points Precisely
One of the most important new features is the introduction of reference markers. They make it possible to mark specific positions directly in the pressure image of the left or right sole.
Unlike live or analysis markers, reference markers are not linked to a specific point in time within the recording. Instead, they refer to a specific position in the pressure image. This allows characteristic pressure situations, pressure peaks, or noticeable load zones to be marked precisely and saved for later evaluation.
Up to 10 reference markers can be placed per recording. This is particularly helpful when specific areas of the foot need to be reviewed regularly or monitored over the course of a treatment or fitting process.
Comparison Function: Before and After at a Glance
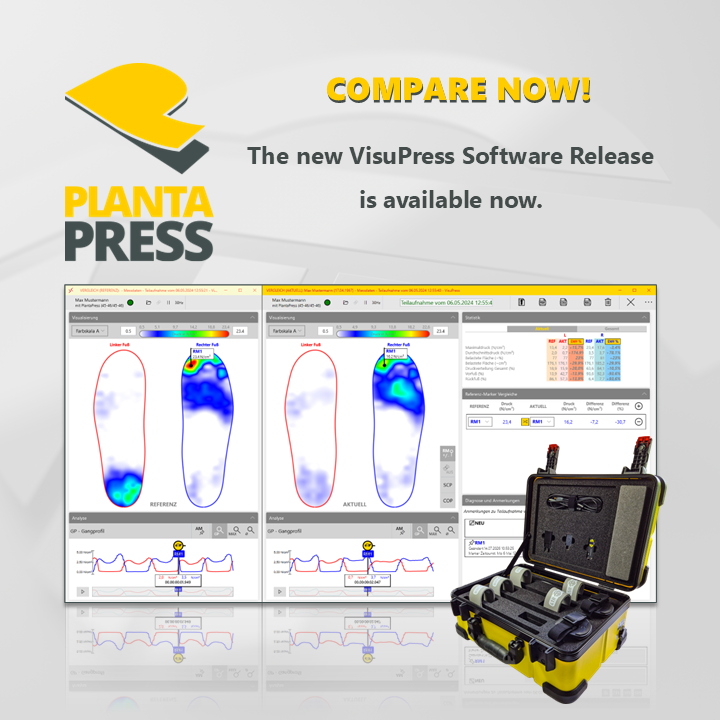
With the new comparison function, pressure values can now be compared even more clearly. VisuPress enables users to compare multiple reference markers within a single recording as well as reference markers from two different recordings.
For example, an initial measurement and a later control measurement can be compared directly. The older recording is displayed as the reference, while the newer recording is shown as the current measurement. This makes it immediately clear how pressure distributions have changed — for instance after an insole adjustment, during the course of treatment, or when comparing different fitting options.
Especially in everyday practice, this provides real added value: changes can not only be identified visually in the pressure image, but also verified using specific measurement values.
Dynamic Comparison Table: Capture Values Quickly
VisuPress now provides a dynamic comparison table below the statistics table. In each row of the table, two reference markers can be compared directly.
The table displays, among other values:
- the pressure value at the reference marker,
- the pressure value at the current marker,
- the difference in N/cm²,
- the percentage change.
This makes differences in pressure conditions easy to identify and interpret. Users receive a clear, structured overview of relevant measurement points — without having to search through raw data.
A particularly practical benefit: the comparison function is not only suitable for before-and-after assessments, but also for directly comparing different pressure areas within the same measurement.
Meaningful PDF Reports for Documentation and Communication
The new comparison options can then be conveniently included in the PDF report. This allows relevant results to be clearly documented, saved, or shared.
In addition to general patient and measurement information, the report can also include analysis results, marker information, and comparison data. For reference marker comparisons, the corresponding pressure images and measurement values can be presented in a traceable way — including difference values and percentage changes.
This simplifies documentation throughout the fitting or treatment process and supports communication with patients, physicians, and other stakeholders. Measurement results are not only made visible, but can also be clearly documented and substantiated.
More Transparency Throughout the Fitting Process
With these new features, VisuPress gives users even more options for targeted evaluation of pressure distributions and for transparently displaying changes throughout a fitting or treatment process.
The benefits at a glance:
- precise marking of relevant pressure points with reference markers,
- direct comparison of pressure values within one recording,
- before-and-after comparison between two measurements,
- clear presentation of differences and percentage changes,
- integration of comparison data into the PDF report.
This makes PlantaPress an even more practical tool for analysis, progress monitoring, and documentation.
Presented at OTWorld in Leipzig
The new VisuPress release was already presented at this year’s OTWorld in Leipzig. Visitors were able to experience the expanded comparison functions live and gain an impression of how simple and intuitive it will be to visualize pressure changes in the future.
With this update, Thorsis Technologies is consistently further developing the PlantaPress foot pressure measurement system — with the aim of providing users with even better tools for measurement, analysis, and documentation in everyday practice.
Would you like to learn more about PlantaPress or the new VisuPress features?
Please feel free to contact us — the Thorsis Technologies GmbH team will be happy to support you with any questions about application, software, and system capabilities.